Fieldpartner update November 2023
- Ricardo Gallardo
- Nov 29, 2023
- 2 min read

New Price Display
We completely changed the way prices are displayed with a new presentation, more user-friendly and with more information
We incorporated the functionality that when choosing a grain price from the Plaza de Rosario, if it is in the Plaza de Chicago, it will automatically show the values of both plazas.

The tables on the left are the evolution of prices in the Rosario and Chicago plazas in this case, the central tables are the evolution in table format and the tables on the right show the annual evolution of each plaza.
The table below shows the price evolution of the Plaza de Chicago vs. the Plaza de Rosario.

We can see that each box has the possibility of downloading the data in Excel, CSV, Image, etc. Format.

We incorporate new indices
NBR index
What does the NBRy tell us?
Normalized Calcination Index is used to calculate or quantitatively identify the calcined areas. This index focuses on measurements at NIR and SWIR wavelengths. Healthy vegetation shows high reflectance in the NIR, while recently burned vegetation areas are highly reflected in the SWIR. This index has become especially instrumental in recent years as extreme weather conditions (such as the El Niño drought) cause a significant increase in wildfires that destroy forest biomass.

The typical use of NBR in the field of agriculture and forestry is the detection of active fires, the analysis of the severity of the burned area and the monitoring of the survival of vegetation after the fire.
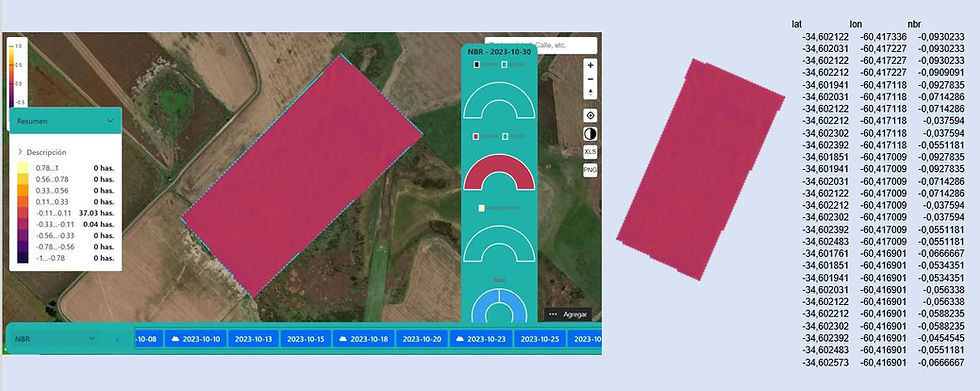
Evolution of NBR in a Batch
The sequence of images below shows how the NBR reflects the changes in a crop.
We can see the application's ability to display actual batch data as well as historical data.

The additional features are:
Image export
Export to numerical data in excel table format showing geolocation data and NBR value
SAVI Index
What is SAVI and what does it tell us?
Soil Adjusted Vegetation Index was designed to minimize the influences of soil brightness. Its creator, Huete, added a soil adjustment factor L to the NDVI equation to correct for the effects of soil noise (soil color, soil moisture, soil variability across the region, etc.), which tend to to affect the results.
The calculation formula is as follows:
SAVI= ((b5-b4)/(b5+b4+0.5))*(1+0.5)

This Vegetation Index is used for the analysis of young crops, for arid regions with scarce vegetation (less than 15% of the total area) and surfaces exposed to the ground.
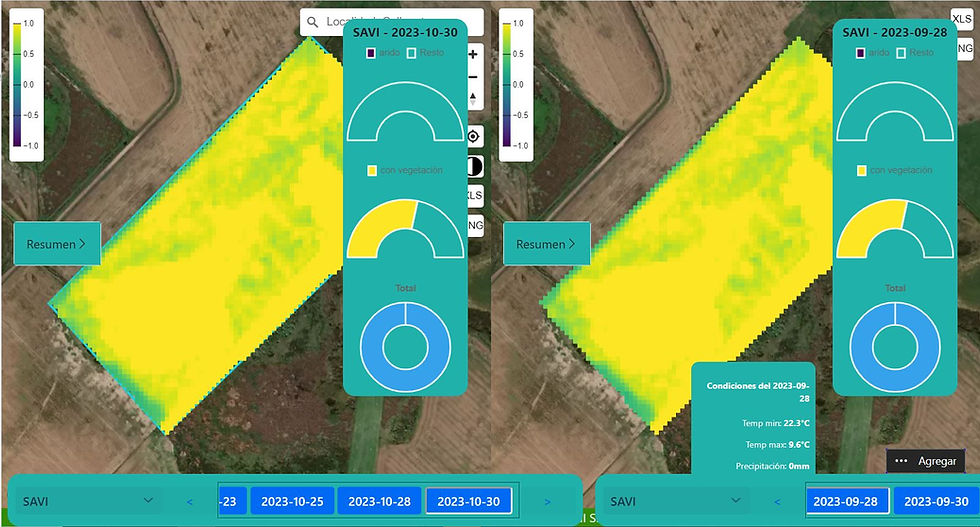
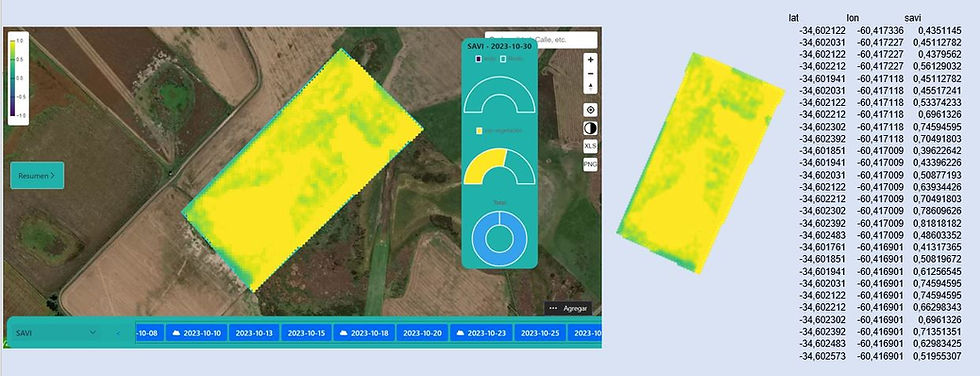
Evolution of SAVI in much
The sequence of images below shows how the SAVI reflects the changes in a culture.
We can see the application's ability to display actual batch data as well as historical data.
The additional features are:
Image export
Export to numerical data in excel table format showing geolocation data and SAVI value
We are working on the incorporation of dNBR index
The dNBR allows us to calculate the difference between two images, before and after the fire, which gives us an idea of the severity of the calcination
The calculation formula is as follows:
DNBR= NIR-SWIR / NIR+SWIR
For an accurate assessment of fire severity we should compare these dNBR values with the in situ measurement. We could monitor vegetation recovery by repeating the calculation of NBR and dNBR from images acquired several months after the fire.