Satellite Images
- Ricardo Gallardo
- Nov 11, 2023
- 10 min read
Our system uses different satellite images each corresponding to a specific spectral band.

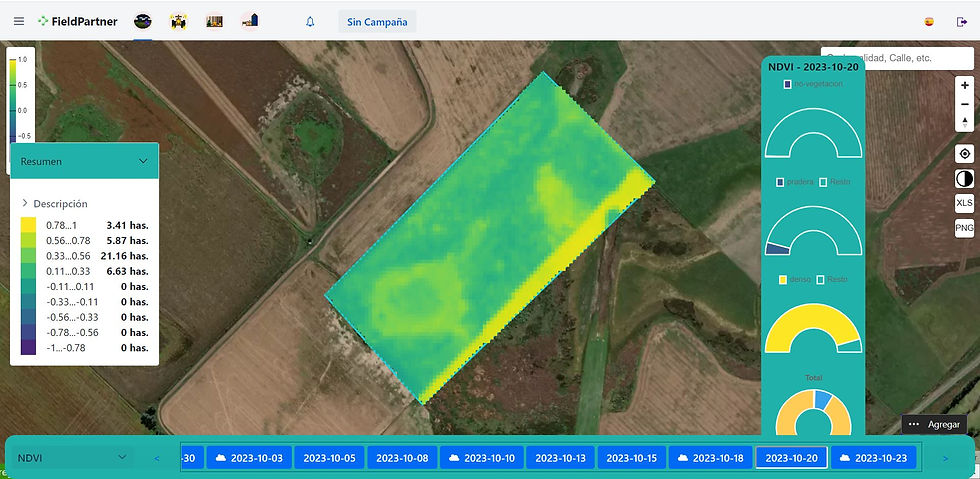
From the moment in which you have defined the Lot, when you click on the last one, a menu will appear with the image shown above that will allow you to access the satellite images of your lot.
In October 2023 we introduced a new way to view the indices in our system.
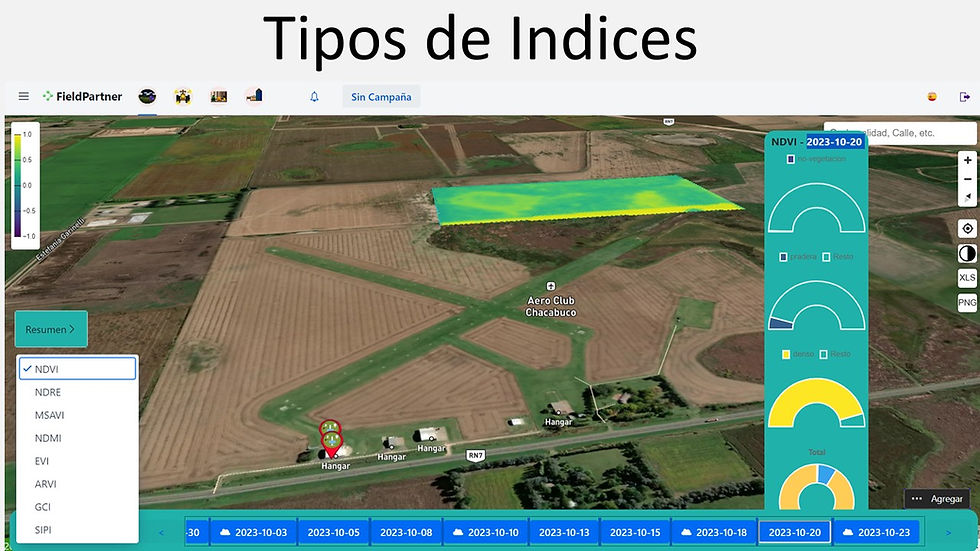
The indices we use are:
NDVI
NDRE
NDMI
MSAVI
EVI
ARVI
GCI
SIPE
NBR
SAVI
Users of previous versions will note that during the course of 2023 we completely changed the way the indices are displayed with a new presentation, more user-friendly and with more information.

We incorporate the visualization of the data from the sensors you have in the lot or field you want to examine, placing the mouse over the sensor, it will display the data read from it.

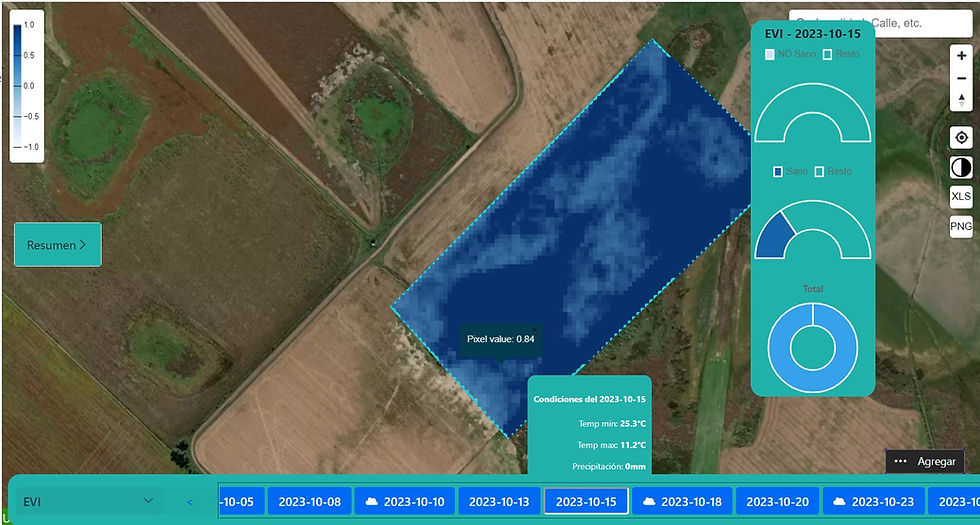
The bar at the bottom of the page allows us to choose the index we want to work with, as well as the dates of the images available in the system.
Some definitions:
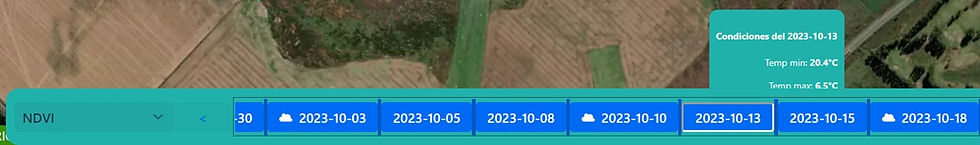
When choosing the day, the maximum and minimum temperature conditions of the day will be displayed. This data can be from the QTS Agro Meteometer weather stations or, if you do not have a meteorology station, we incorporate meteorological data from a platform. The data from the platform will not have the precision of our plants since they are estimated and not measured on site.
New color scale by index, display of pixel value when passing through the image.
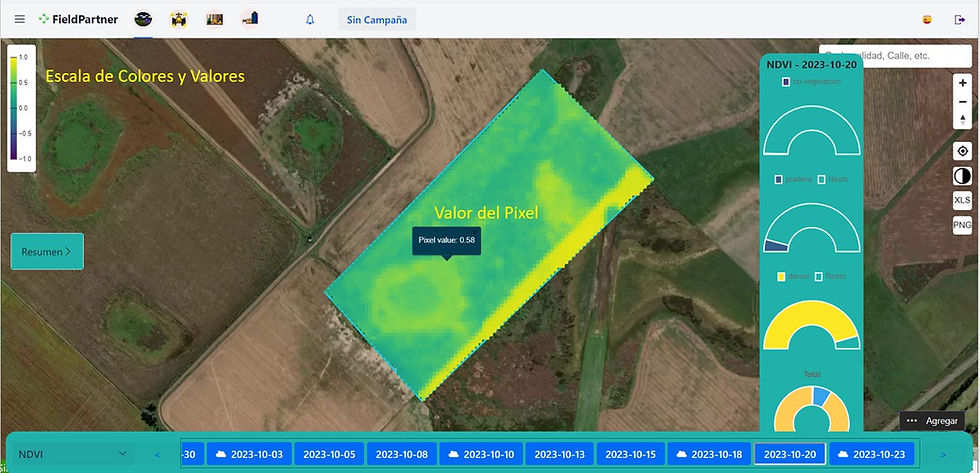
We incorporate a new percentage summary of values based on the area of the lot
In the summary you will also be able to access a brief description of the index you are using or have selected.
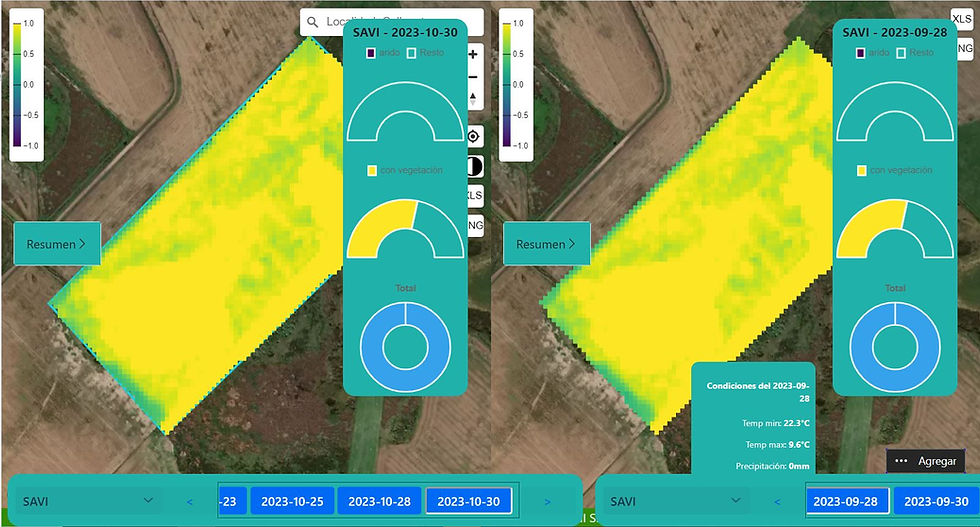
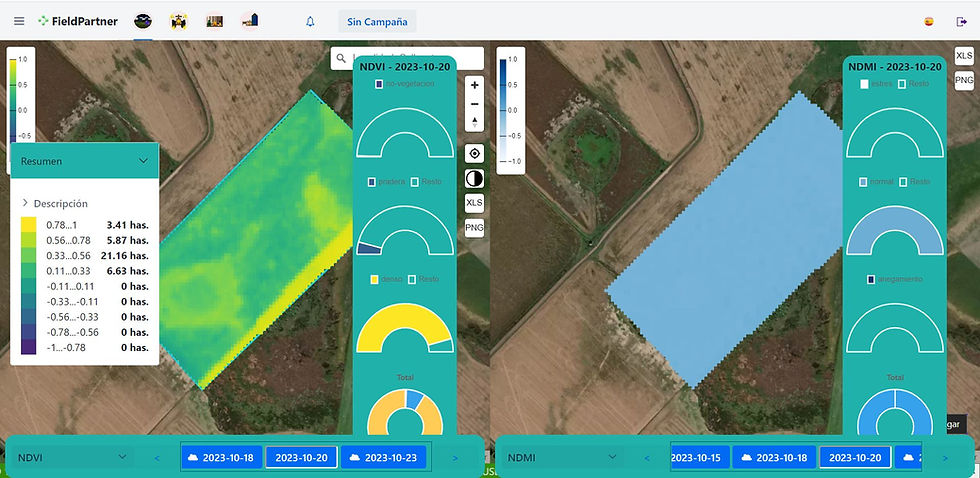
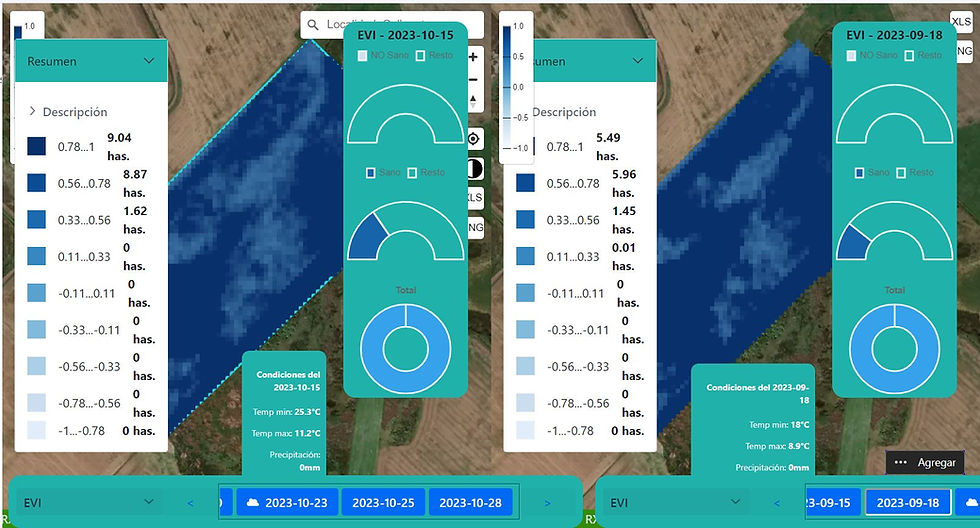
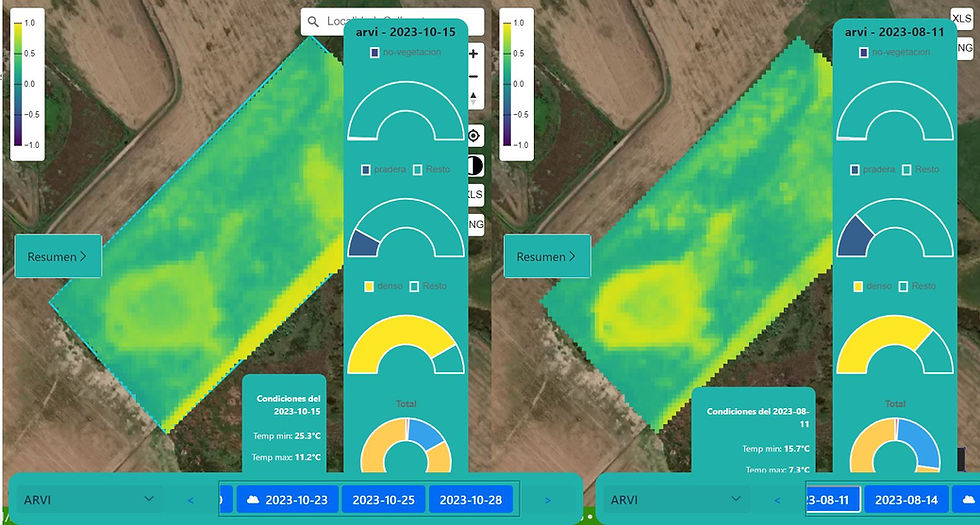
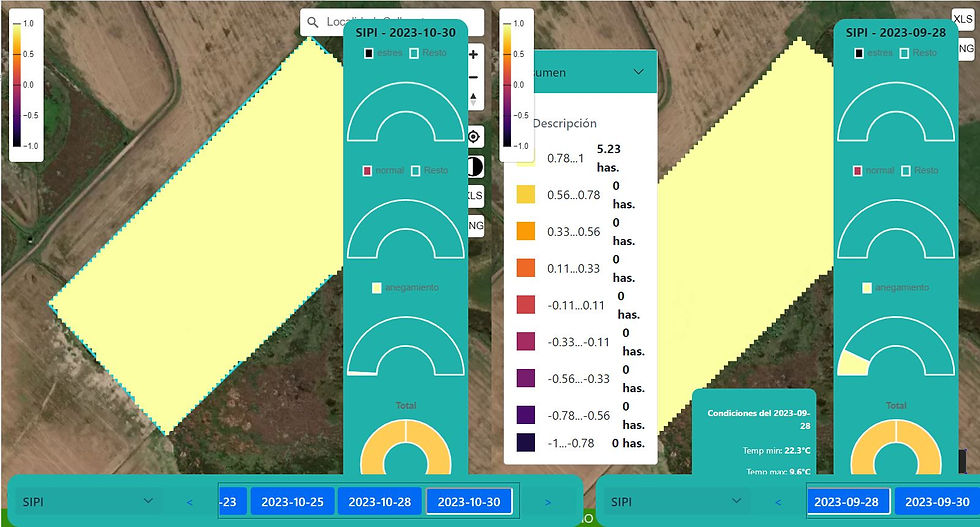
Comparison of evolution of the same index as a function of time:
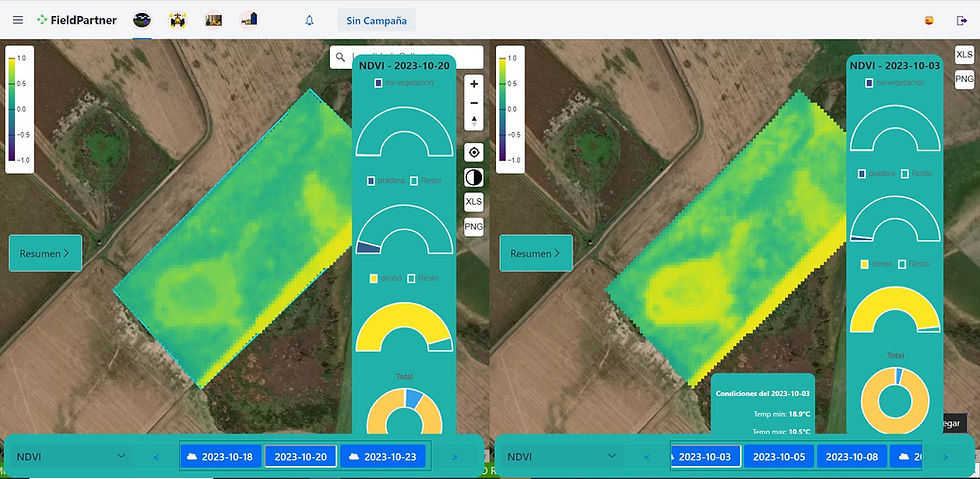
We can see the same comparison with the summaries of each image and thus have a better perspective.

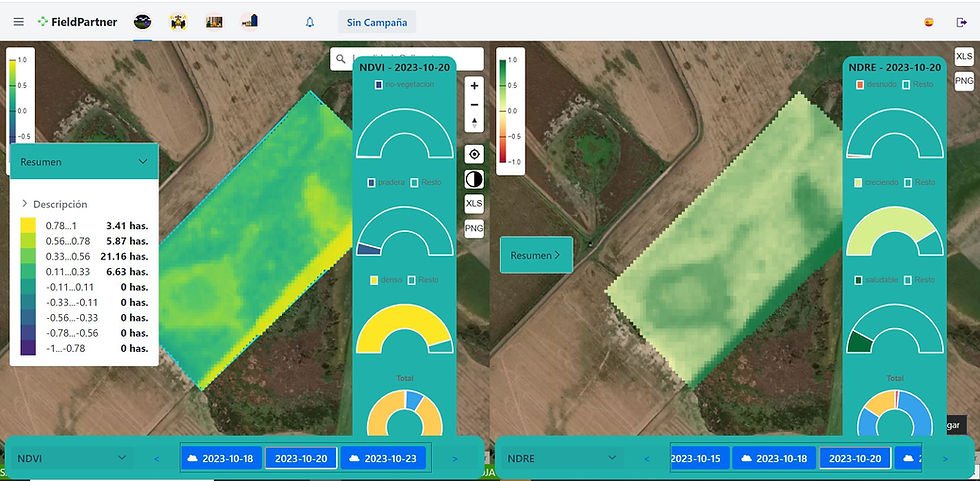
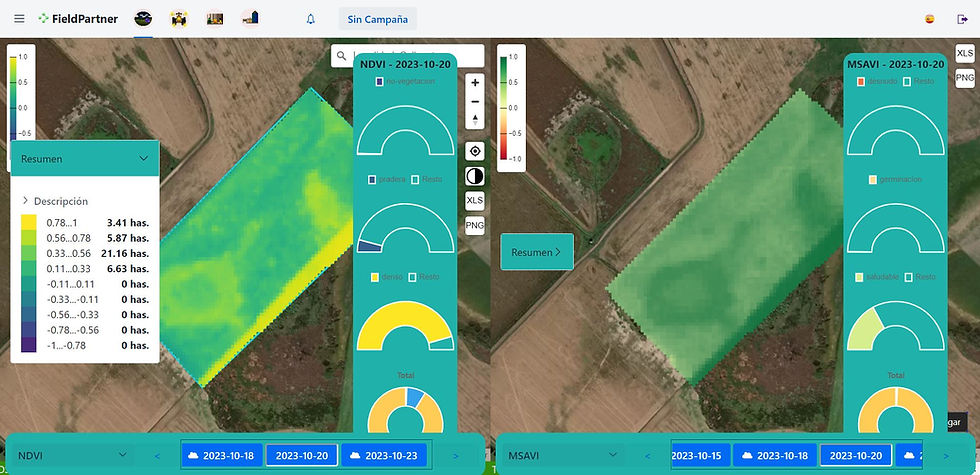
Visualization of different indices among themselves using the same image or images belonging to different days.
What indices the system allows to work:
NDVI
NDRE
NDMI
MSAVI
EVI
ARVI
GCI
SIPE
NBR
SAVI
A little theory about the use of indices.
What is NDVI and what does it tell us?
The NDVI or Green index also called Normalized Difference Vegetation Index NDVI is a numerical indicator of the quantity and quality of vegetation and is calculated from the decomposition of satellite images into a matrix or table with Longitude, Latitude and Numerical value of the analyzed pixel.
A healthy plant, with lots of chlorophyll and good cellular structure, actively absorbs red light and reflects near-infrared light.
In the case of diseased plants, it is a reverse process.

The NDVI shows the relationship between the difference in the intensity of reflected light in the red and infrared ranges and their sum.
NDVI = (NIR-Red) / (NIR+Red)
The values of this vegetation index for plants range between 0 and 1.
The NDVI tells us whether an area of the lot is developing normally in the current phase.
At the beginning and end of the season, the NDVI is generally less than 0.5, while this value increases in the middle of the campaign.
Optimal NDVI values depend on the crop and the development phase.
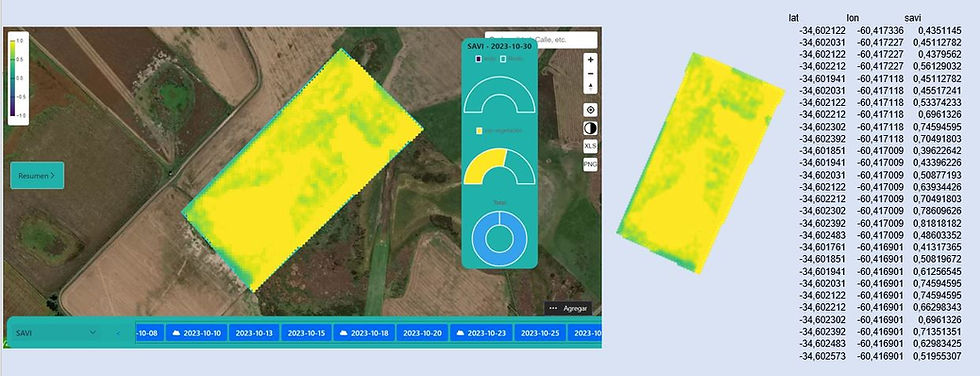
Evolution of NDVI in a Batch
The sequence of images below shows how the NDVI reflects the changes in a crop.
We can see the ability of the application to display the data of a real batch, the functionalities are, image export, export to numerical data in Excel table format showing the geolocation data and the NDVI value.
Data was taken from 4-8-23 to 7-25-23.


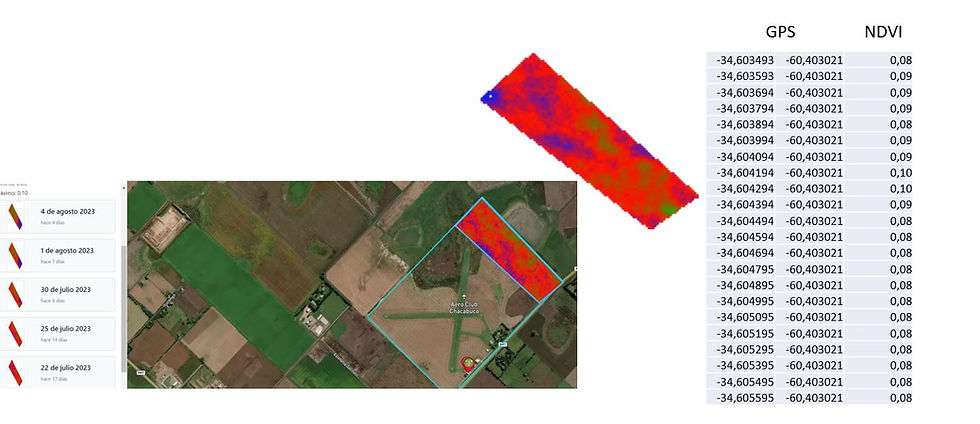
As can be seen both numerically and in the images, the index values change a lot in this particular batch.
Symbology NDMI index maps vary on the white to blue color spectrum. As there is greater moisture content in the vegetation, the sampling of the color palette moves towards intense blues, the index approaches 1.
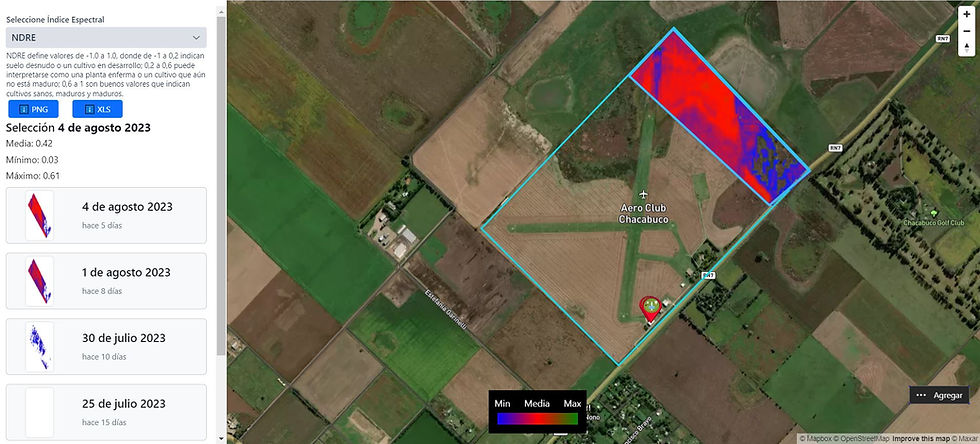
What is the NDRE and what does it tell us?
The NDRE or Normalized Difference Red Edge Index is useful for analyzing plant vigor in multispectral sensor images throughout the crop cycle.
“Red edge” light can pass through the leaves much more deeply than red light (used in NDVI), yielding values with less tendency to saturation and better expressing variability than NDVI in specific studies, because it is sensitive to a wider range of crop chlorophyll concentration, nitrogen concentration, leaf area index and biomass.
This index detects changes in the chlorophyll content, which is one of the main indicators of nitrogen inside the leaves.
NDRE = (NIR – RED EDGE) / (NIR + RED EDGE)
NDRE can be used as a single monitoring point, as well as in combination with NDVI during the entire period of plant cover aging, from planting date to harvest. The index gives a complete picture of Chlorophyll content, which is one of the main indicators of nitrogen and helps generate maps of where fertilizer application is necessary. While analyzing NDRE images, the color palette typically goes from red to green, where red is bare soil, pale yellow to pale green are unhealthy plants or vegetation that is at the beginning of their maturation, and lastly, green is a healthy mulch
What is Chlorophyll Content?
Chlorophyll is a pigment that gives plants their characteristic green color. Plants depend on it to survive as it absorbs sunlight which they then convert into sugars and starches through a process called photosynthesis. Therefore, chlorophyll is a good indicator of plant health.
By measuring the spectral reflectance of chlorophyll in plants from space, we can monitor the condition of crops on a regular basis. For this, the chlorophyll vegetation index is used.
Uses of the chlorophyll index in precision agriculture are:
Identification of nutritional deficiencies in plants
Evaluation of the absorption of nitrogen fertilizers
Performance prediction
VRA prescription mapping and much more
Evolution of the NDRE in a Batch
The sequence of images below shows how the NDRE reflects the changes in a crop.
We can see the ability of the application to display the data of a real batch, the functionalities are, image export, export to numerical data in Excel table format showing the geolocation data and the NDRE value.
Data was taken from 4-8-23 to 7-25-23.
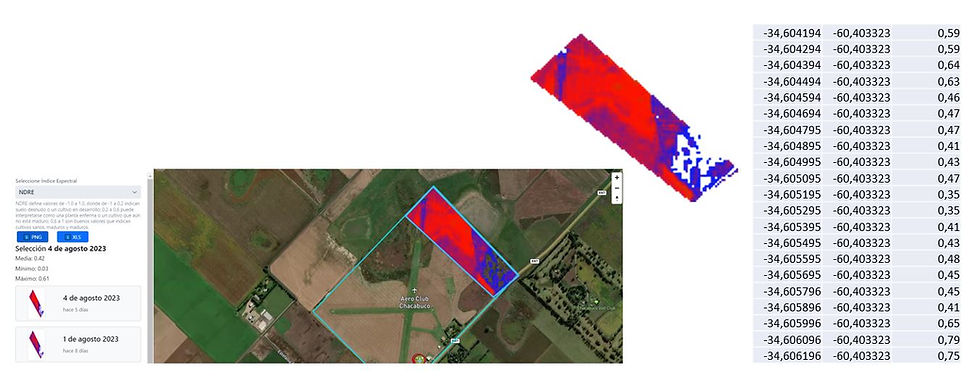
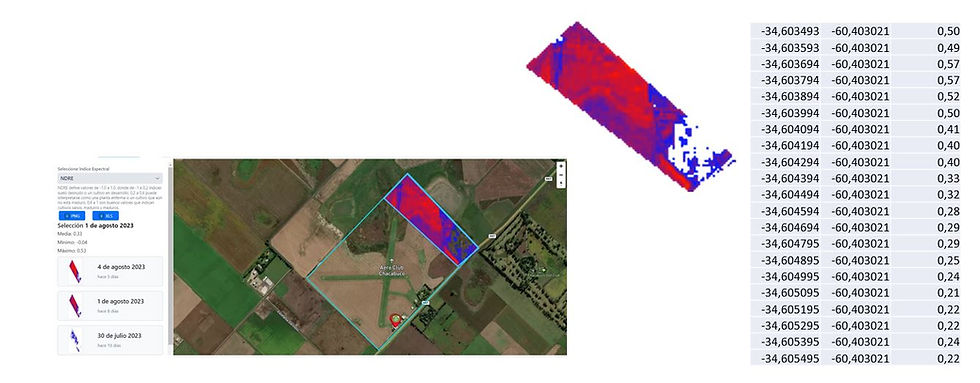
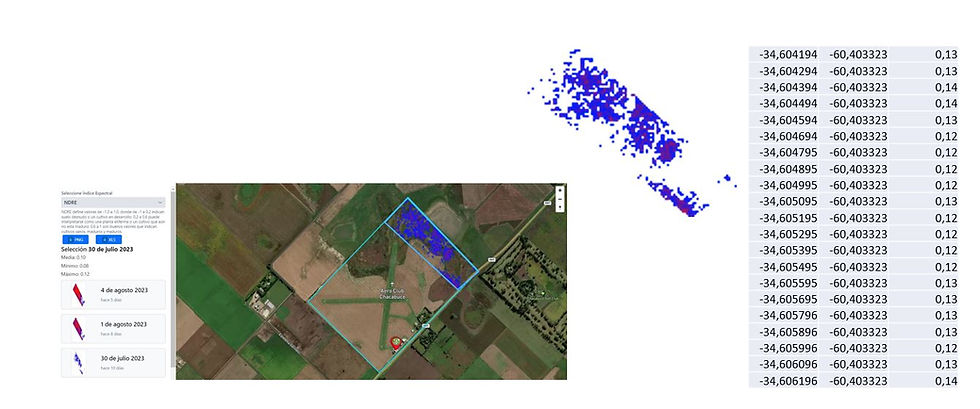
As can be seen both numerically and in the images, the index values change a lot in this particular batch.
Symbology The NDRE index is presented with the same palette as the rest of the vegetation indices, starting with brown colors (lowest index) and then going through a varied range of greens and expressing high index values in blue tones up to green.
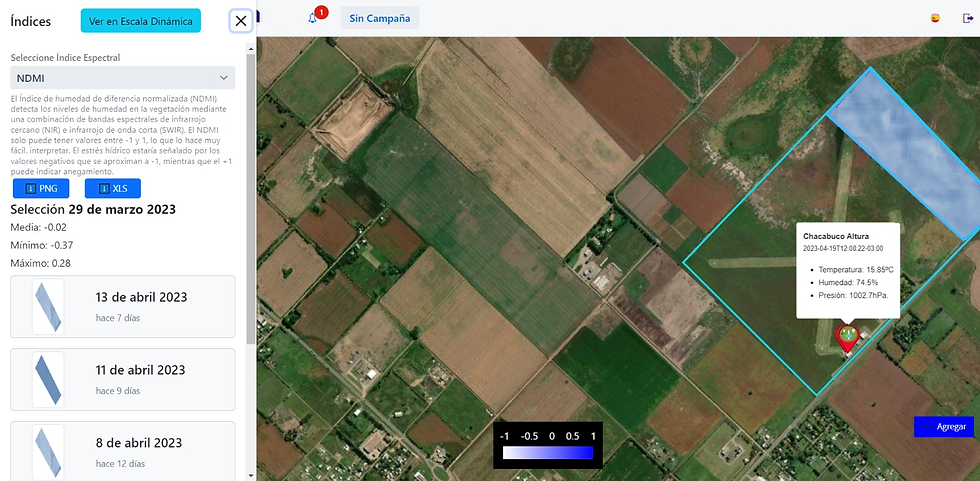
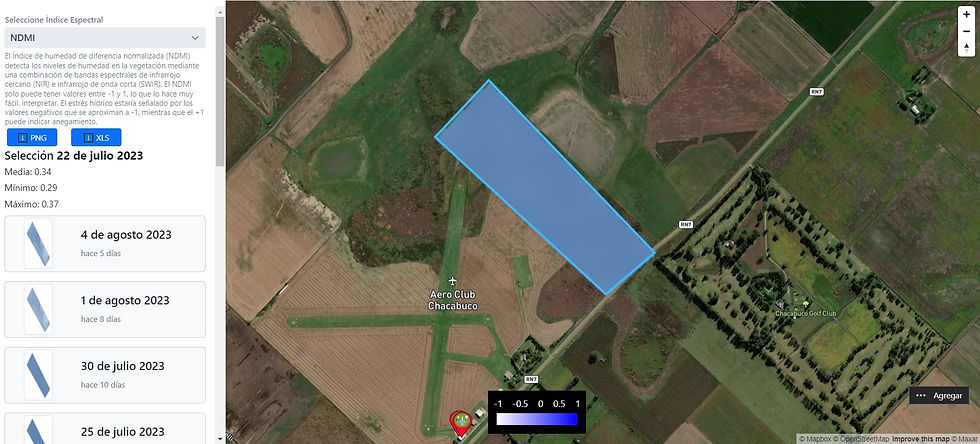
What is NDMI and what does it tell us?
The Normalized Differential Moisture Index NDMI – Normalized Difference Moisture Index is obtained by comparing the near infrared band with the shortwave infrared band, sensitive to foliar moisture absorption.
It is a good indicator of water in the plant.
We use NDMI to:
Regular monitoring of crop humidity.
Determination of areas with water stress for a lot/establishment.
Early harvest logistics, plan harvest order.
Determination of combustibility levels in areas vulnerable to fires.
Is calculated:
NDMI = (NIR – SWIR) / (NIR + SWIR)
The NIR and SWIR bands are selected for the NDMI band equation to mitigate the effects of lighting and atmosphere. The shortwave infrared (SWIR) spectral channel is sensitive to the water content of vegetation and the mesophyll structure of leaves. On the other hand, the near infrared (NIR) band collects the bright reflectance of the internal structure of the leaf and its dry matter content. When combined, the accuracy of data on vegetation water content is much higher. Furthermore, NDMI is a better indicator of deforestation than NDVI thanks to a less abrupt decrease in values.
Like most indices, the NDMI can only have values between -1 and +1, making it easier to interpret. Water stress would be indicated by negative values that are close to -1, while +1 can indicate waterlogging.
Bare Soil -1 to -0.8
Almost non-existent canopy cover -0.8 to -0.6
Very low canopy cover -0.6 to -0.4
Low and dry or very low and wet canopy cover -0.4 to -0.2
Medium-low canopy cover and high water stress or low canopy cover and low water stress -0.2 to 0
Medium canopy cover and high water stress or medium-low canopy cover and low water stress 0 to 0.2
Medium-high canopy cover and high water stress or medium cover and low water stress 0.2 to 0.4
High canopy cover, no water stress 0.4 to 0.6
It is important to note that NDMI values vary throughout the growing season because the reflectance of plants is slightly different in each phenological phase.
Evolution of NDMI in a Batch
The sequence of images below shows how NDMI reflects the changes in a crop.
We can see the ability of the application to display the data of a real batch, the functionalities are: image export, export to numerical data in Excel table format showing the geolocation data and the NDMI value.
Data was taken from 4-8-23 to 7-25-23.
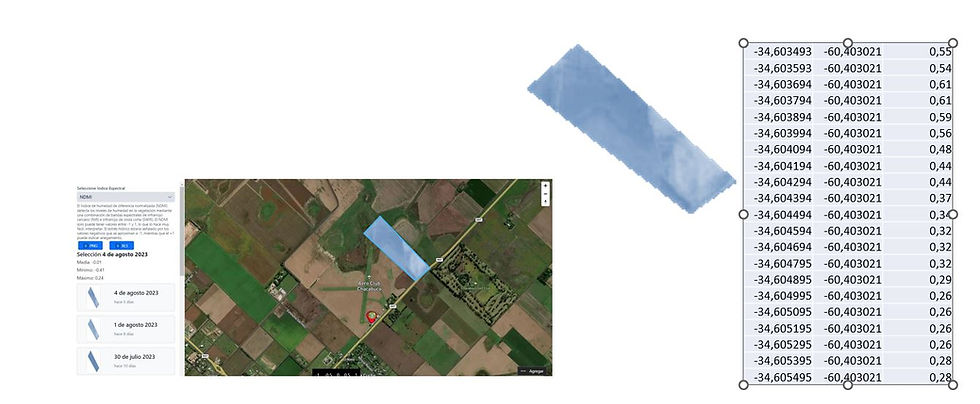

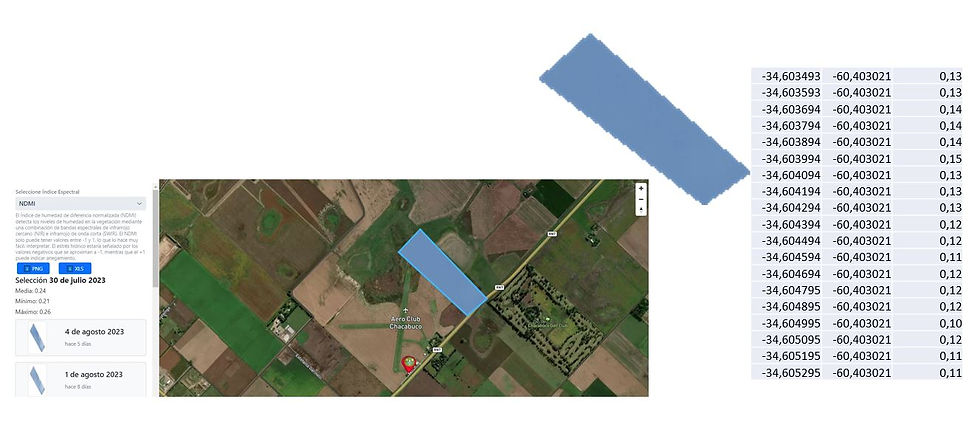
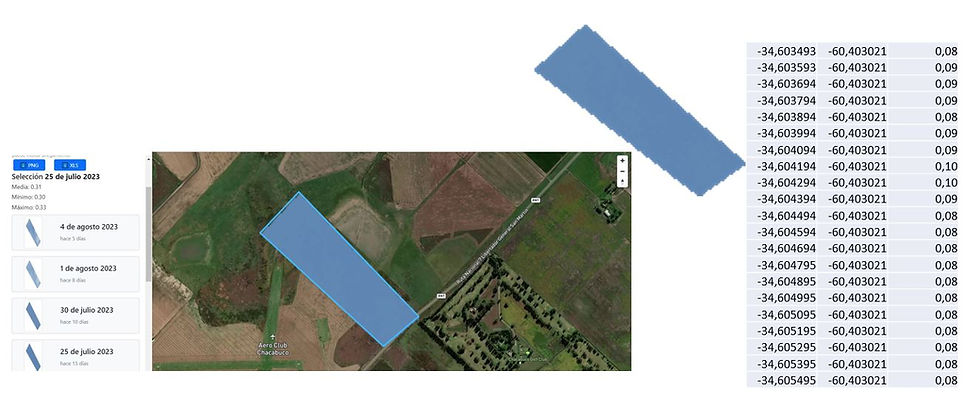
Symbology NDMI index maps vary on the spectrum from white to blue.
As there is greater moisture content in the vegetation, the palette moves towards intense blues, the index approaches 1.
What is MSAVI and what does it tell us?
The MSAVI index is used in the initial stages of cultivation, when the plant is at the beginning of its development.
It is at this time that the NDVI index has certain limitations in detecting this initial growth. This is because the plant is very small in size, a few centimeters, or when there is a greater proportion of soil than vegetation in the lot, with a large distance between the plants, in the southern area of the pivot.
MSAVI = (2 * Band 5 + 1 – sqrt ((2 * Band 5 + 1)2 – 8 * (Band 5 – Band 4))) / 2
The modified soil-adjusted vegetation index is a vegetation index used to extend the application limits of NDVI to areas with a high bare soil composition. MSAVI is used in areas where indices like NDVI or NDRE provide invalid data, mainly due to a small amount of vegetation or due to lack of chlorophyll in it. Thus, the index is used to minimize the influence of the soil background and to increase the dynamic range signaled by the vegetation.
As we mentioned previously, in fields where plants have just been planted, other indices would not obtain exact data and, consequently, would mislead the farmer; there may not be the possibility of adequate treatment for the field. MSAVI, for its part, allows the monitoring of crop conditions in its early stages of development, since it is specifically designed for this purpose. Therefore, the farmer has the possibility of applying fertilizers only where and when necessary. This approach allows you to optimize the initial management of the field from scratch, resulting in increased profits and reduced environmental impact.
Evolution of MSAVI in a Batch
The sequence of images below shows how the MSAVI reflects the changes in a culture.
We can see the ability of the application to display the data of a real batch, the functionalities are: image export, export to numerical data in Excel table format showing the geolocation data and the MSAVI value.
Data was taken from 4-8-23 to 7-25-23.
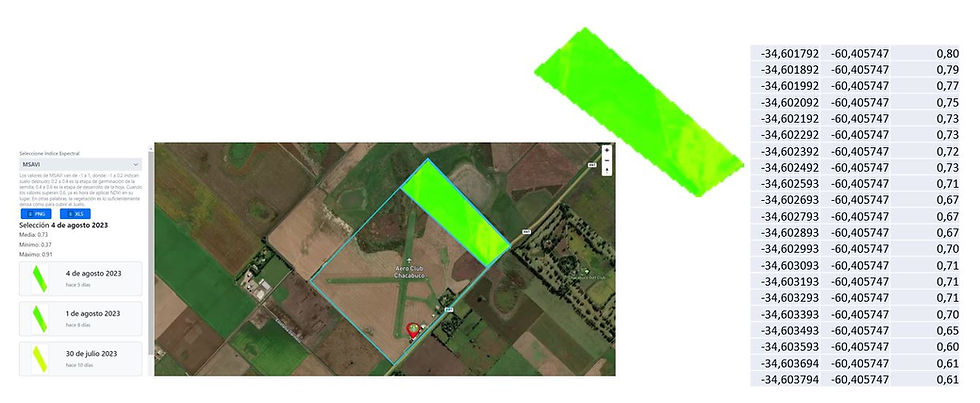
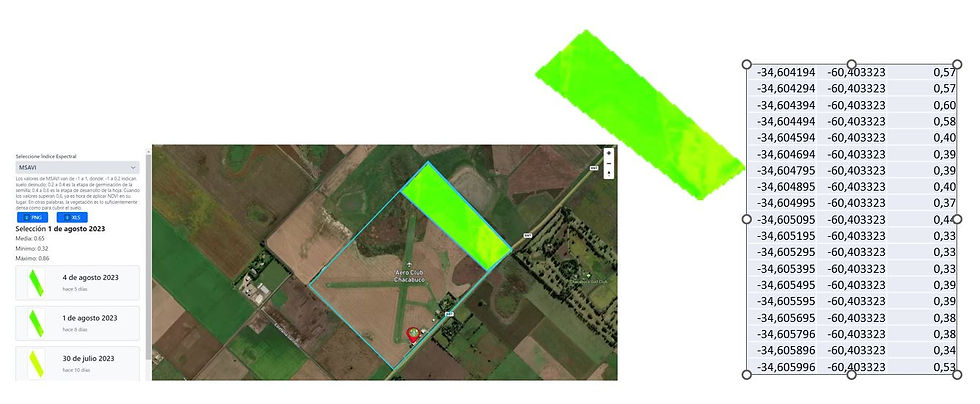
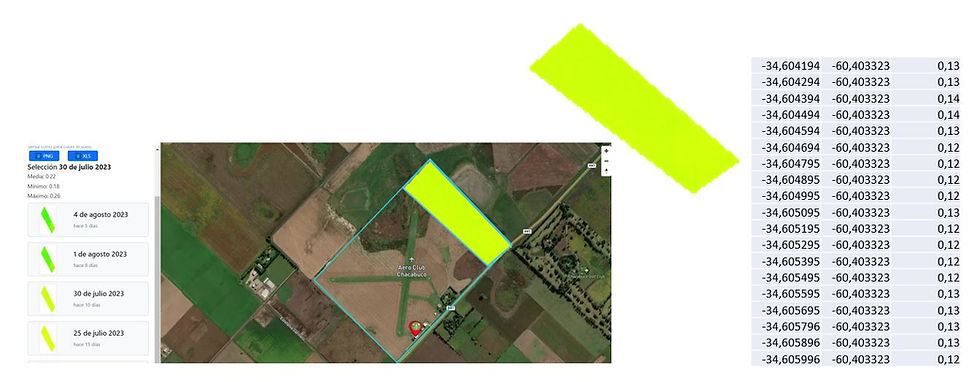
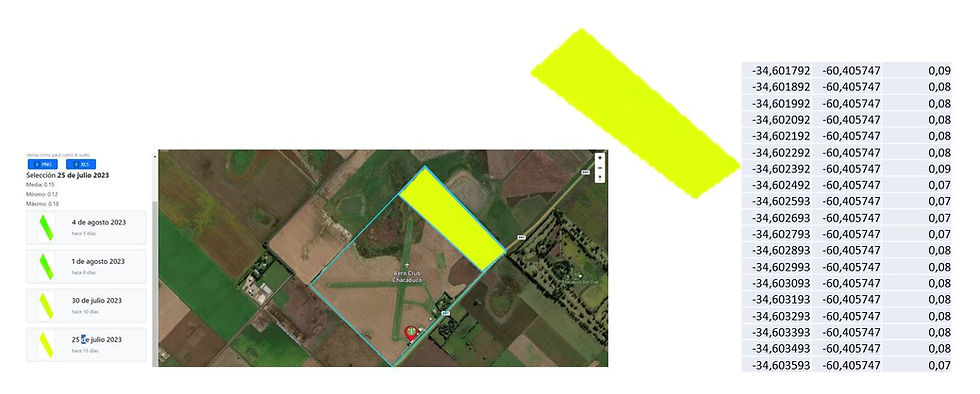
Symbology
-1 to 0.2 indicate bare soil
0.2 to 0.4 is the seed germination stage
0.4 to 0.6 is the leaf development stage
When the values exceed 0.6 it is time to apply NDVI instead
What is the EVI and what does it tell us?
The EVI or Enhanced Vegetation Index expresses atmospheric effects by calculating the difference in radiance between the Blue and Red bands and allows us to monitor the state of the vegetation in case of high biomass densities.
The process turns out to be similar to the NDVI calculation except that, on this occasion, we also require the band corresponding to Blue of the visible spectrum.
The calculation formula is as follows:
EVI = 2.5 * ((NIR – RED) / ((NIR) + (C1 * RED) – (C2 * BLUE) + L))
This is useful for analyzing areas of the earth with large amounts of chlorophyll, an example of which could be tropical forests, preferably with minimal topographic effects (non-mountainous regions).
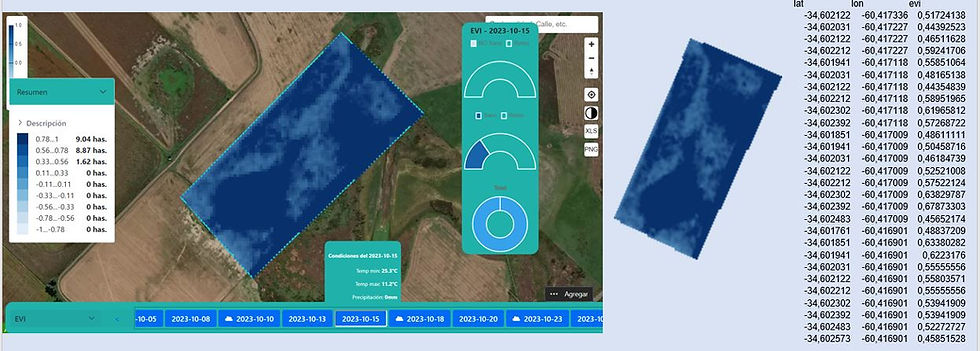
Evolution of the EVI in a Batch
The sequence of images below shows how the EVI reflects the changes in a crop.
We can see the application's ability to display real batch data as well as historical data.
The additional features are:
Image export
Export to numerical data in excel table format showing geolocation data and EVI value
What is ARVI and what does it tell us?
ARVI or Atmospheric Resistant Vegetation Index is the first vegetation index that is relatively prone to atmospheric factors (such as aerosol). The ARVI formula invented by Kaufman and Tanré is basically corrected over NDVI for atmospheric scattering effects on Red band reflectance by using measurements at Blue band wavelengths.
The calculation formula is as follows:
ARVI = (NIR – (2 * RED) + BLUE) / (NIR + (2 * RED) + BLUE)
Its use usually focuses on regions with high content of atmospheric aerosol, rain, fog, dust, smoke, air pollution).
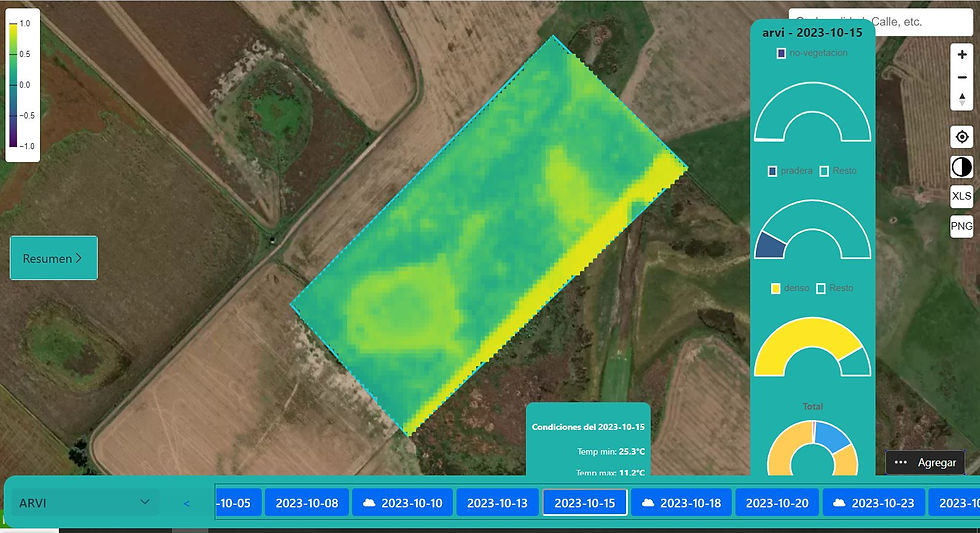
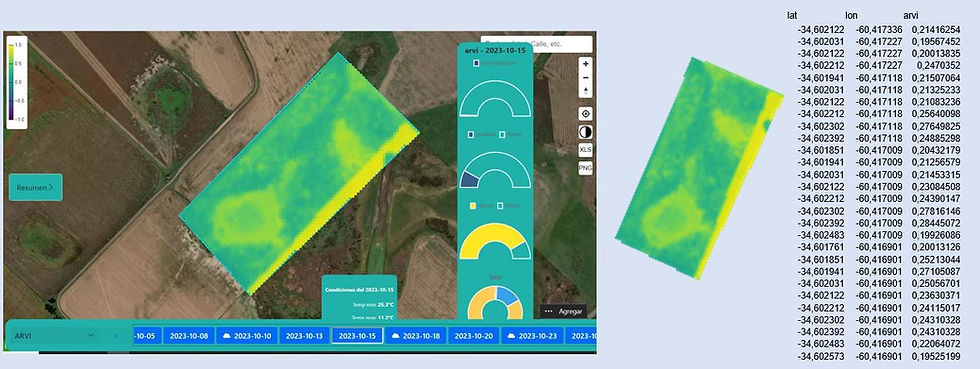
Evolution of ARVI in a Batch
The sequence of images below shows how ARVI reflects the changes in a crop.
We can see the application's ability to display real batch data as well as historical data.
The additional features are:
Image export
Export to numerical data in excel table format showing geolocation data and ARVI value
What is the GCI and what does it tell us?
GCI or Green Chlorophyll Index is used to estimate the chlorophyll content of leaves in various plant species. The chlorophyll content reflects the physiological state of the vegetation; decreases in stressed plants and can therefore be used as an evaluator of plant vigor.
The calculation formula is as follows:
GCI = NIR / GREEN – 1
This Vegetation Index is useful to monitor the impact of seasonality, environmental stress or, also, the application of pesticides on their effect on plant health.
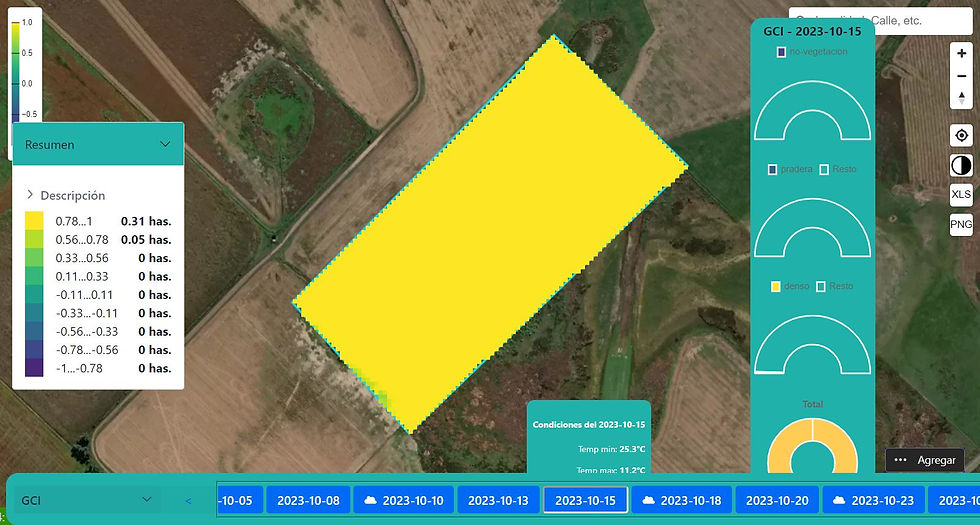
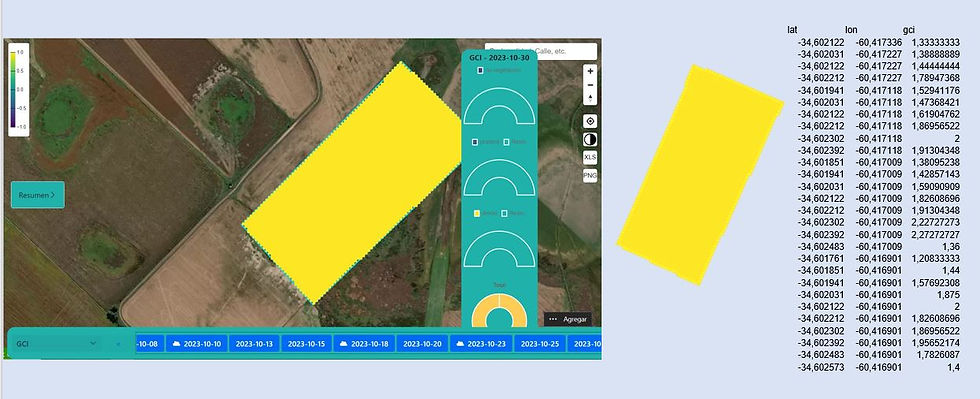
Evolution of the GCI in a Lot
The sequence of images below shows how the GCI reflects the changes in a crop.
We can see the application's ability to display real batch data as well as historical data.
The additional features are:
Image export
Export to numerical data in excel table format showing geolocation data and GCI value

What is SIPI and what does it tell us?
Structure Insensitive Pigmentation Index is good for the analysis of vegetation with variable canopy structure. Estimate the ratio of carotenoids to chlorophyll: the most valuable signals of stressed vegetation.
The calculation formula is as follows:
Fórmula: SIPI = (NIR – BLUE) / (NIR – RED)

We can use it to monitor plant health in regions with high variability in canopy structure or leaf area index, for early detection of plant diseases or other causes of stress.
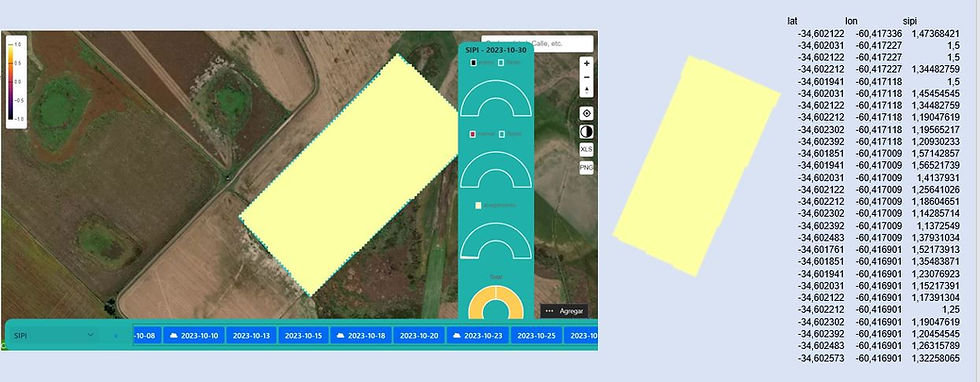
Evolution of the SIPI in a Lot
The sequence of images below shows how the SIPI reflects the changes in a crop.
We can see the application's ability to display real batch data as well as historical data.
The additional features are:
Image export
Export to numerical data in excel table format showing geolocation data and SIPI value
What is NBR and what does it tell us?
Normalized Calcination Index is used to calculate or quantitatively identify the calcined areas. This index focuses on measurements at NIR and SWIR wavelengths. Healthy vegetation shows high reflectance in the NIR, while recently burned vegetation areas are highly reflected in the SWIR. This index has become especially instrumental in recent years as extreme weather conditions (such as the El Niño drought) cause a significant increase in wildfires that destroy forest biomass.
The calculation formula is as follows:
NBR = (NIR – SWIR) / (NIR + SWIR)

The typical use of NBR in the field of agriculture and forestry is the detection of active fires, the analysis of the severity of the burned area and the monitoring of the survival of vegetation after the fire.
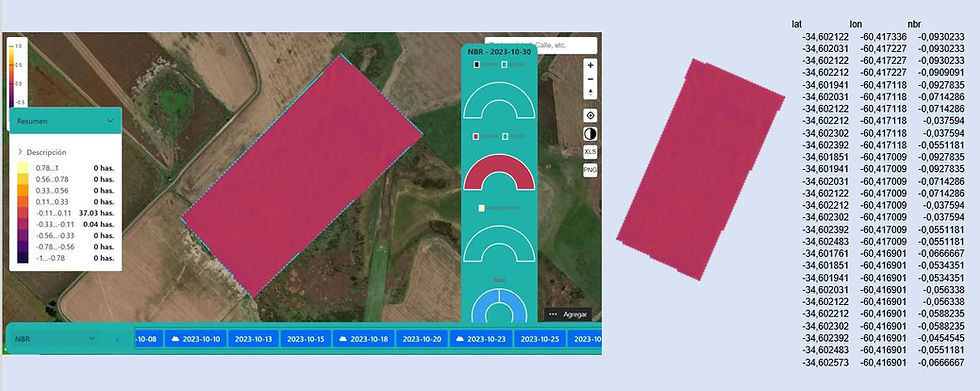
Evolution of NBR in a Batch
The sequence of images below shows how the NBR reflects the changes in a crop.
We can see the application's ability to display real batch data as well as historical data.
The additional features are:
Image export
Export to numerical data in excel table format showing geolocation data and NBR value

What is SAVI and what does it tell us?
Soil Adjusted Vegetation Index was designed to minimize the influences of soil brightness. Its creator, Huete, added a soil adjustment factor L to the NDVI equation to correct for the effects of soil noise (soil color, soil moisture, soil variability across the region, etc.), which tend to to affect the results.
The calculation formula is as follows:
SAVI= ((b5-b4)/(b5+b4+0.5))*(1+0.5)

This Vegetation Index is used for the analysis of young crops, for arid regions with sparse vegetation (less than 15% of the total area) and exposed soil surfaces.
Evolution of SAVI in a Batch
The sequence of images below shows how the SAVI reflects the changes in a culture.
We can see the application's ability to display real batch data as well as historical data.
The additional features are:
Image export
Export to numerical data in excel table format showing geolocation data and SAVI value